This is the third of a series of posts where I will show you how you can use free open source software Jenkins and JMeter to monitor your APEX database.
Part 1 - Monitor your APEX app using Jenkins
Part 2 - Monitor your APEX app using Google Analytics
In the next post, I will show you how you can run scheduled Selenium tests on your APEX app, the tests will log into your app and run Selenium tests which will be hosted on a free GitHub account using GitHub actions so no installation of any software necessary. You will have your APEX application scheduled selenium tests (getting email alerts if any issues with your APEX application) up in running in minutes by cloning a ready-made GitHub APEX selenium repo.
Prerequisite: Install JMeter on the same server as Jenkins. Like Jenkins, JMeter is simple to set up and there are lots of online guides, so I won't go into it here.
First we are going to set up the DB monitoring job on JMeter then schedule it from Jenkins.
Run JMeter in GUI mode
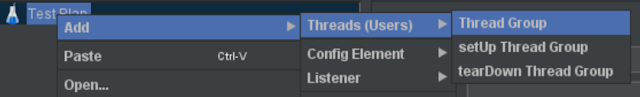
Add a thread group
Add a
JDBC Connection configuration to connect to your APEX DB;
give it the name
oracle_db, (
we are going to use this in the JDBC request) and enter your database connection details;
now we add the JDBC request, in this case I want to ensure that a table has been updated in the last 24 hours and if it hasn't, I want alerted by email;
select
CASE
WHEN max(w_update_dt) < sysdate-1
THEN
'WARNING Reload older then 1 day'
ELSE
'OK'
END status
from PDRL2.
eprint_pdr_publications
now add the actual JDBC request;

this is where we are going to add the SQL, put in oracle_db as the connection config name;
Now we add the check to ensure the data is not stale by adding a BeanShell Assertion;
Note we are referencing
dataFromDb which was set up in the
JDBC Request. The code is;
log.info("Response is " + vars.getObject("dataFromDB").get(0).get("STATUS"));
if (prev.getResponseMessage() != "OK" ||
!vars.getObject("dataFromDB").get(0).get("STATUS").equalsIgnoreCase( "OK"))
{
SampleResult.setSuccessful(false);
IsSuccess=false;
SampleResult.setStopTestNow(true);
}
The whole job looks like this
The view results tree, summary report etc are for viewing the results. Try it out by pressing the green button;
View the results in the View results tree. If everything is OK, we are ready to set up Jenkins to schedule it;
I am saving it as Oracle_ensure_publication_data_recent.jmx which we are going to call from Jenkins. I also created a directory Oracle_ensure_publication_data_recent which is where the results are stored.
In Jenkins, create a new freestyle item (same as setting up item in part 1) and configure how often it will run;
Build is where we call the JMeter job, as both Jenkins and JMeter are installed on the same server we reference the JMeter job like this;
C:\apps\apache-jmeter-5.2.1\bin\jmeter -n -t C:\apps\apache-jmeter-5.2.1\bin\oracle_db_ensure_publication_data_recent.jmx -f -l C:\apps\apache-jmeter-5.2.1\bin\oracle_db_ensure_publication_data_recent.jtl -e -o C:\apps\apache-jmeter-5.2.1\bin\oracle_db_ensure_publication_data_recent_output
Set the error threshold;
list the emails any alerts will be sent to;
Your APEX database is now monitored. Once you have set up one job its easy to set up subsequent jobs by following the same principles. I have several jobs monitoring our APEX DB, sending alerts if it identifies any problems.
Tip
When creating another JMeter schedule in Jenkins, type in your existing JMeter job and just change the JMeter script in the build.


Comments
Post a Comment